
Leave Analysis Report - Staff (Report)
Overview
This ‘Leave Analysis Report - Staff (Report)’ program is designed for heads of departments or otherwise authorised staff to view leave analysis details for teachers and other staff.
This program can be accessed by navigating to the Staff Kiosk Payroll/HR menu.
User Security Permissions
Access to this program is controlled by the ‘Leave Analysis - Staff (Report)’ security point in TASS.web System Admin > Users > Portal Security Permissions for Staff Kiosk. Contact your school’s TASS System Administrator for access.
About the Staff Leave Analysis Report
The data used by this report comes from the TASS.web Payroll HRM > Payroll module.
Example
An example of the Analysis Chart:
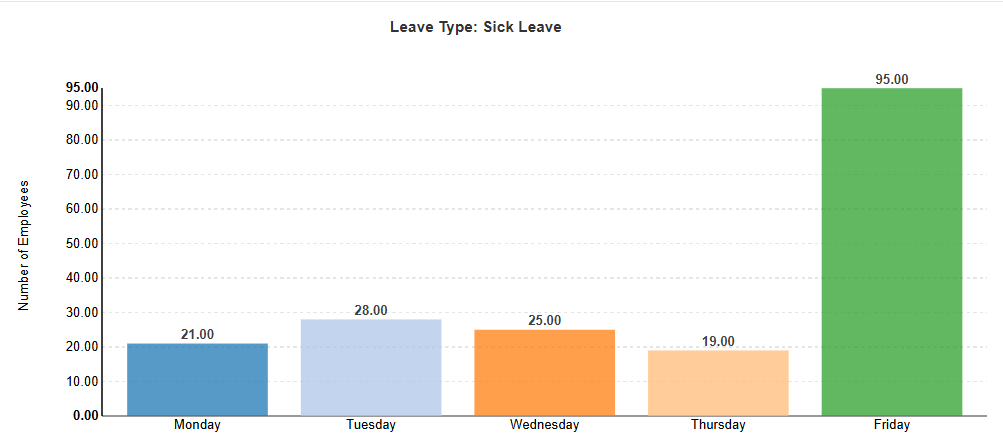
An example of the Trend Chart:
Selection Criteria
The ‘Leave Analysis Report - Selection Criteria’ screen is divided into five sections:
Employee Filters
Leave Filters
Printing Options
Sorting Options
Formatting Options
Employee Filters
Use the ‘Employee’ search criteria fields to target the group of employees to include in your report.
Leave Filters
Use the ‘Leave’ search criteria fields to target the type of leave and date range to include in your report.
Example
Sick Leave between January 1st and June 10th.
Printing Options
Use the ‘Printing Options’ section to select the type of report that you want to produce and how you want to analyse it.
This report can be generated using various formats:
Analysis Summary Report | This report format provides a breakdown by employee, pay point, award, or gender for the selected leave type. Use the ‘Analysis By’ field to choose how to analyse and break down this data. |
Analysis Chart & Report | This report format creates a graph by pay point, award, or gender for the selected leave type. The X-axis shows pay points, and the Y-axis displays the number of days. A report is generated by clicking on one of the bars in the chart. Use the ‘Analysis By’ field to choose how to analyse and break down this data. |
Exception Chart & Report | This report produces a pie chart based on the selected leave type, broken down by the number of days, e.g., Sick leave 0 days, 1-5 days, 6-10 days. Drill-down is available by clicking any section of the pie chart. |
Trend Chart | Generates a bar chart based on the selected leave type, showing data by days of the week. |
Sorting Options
Use the ‘Sorting Options’ to select your report sort order. You can sort the report by Employee Surname or Number of Leave Days.
Formatting Options
Use the ‘Formatting Options’ to select your preferred export format.
Select the ‘Page Break By Sort Field’ checkbox to format the report by separating the results into pages based on the 'Sort By' selection.
The 'Analysis Summary Report' can be exported to PDF, Excel, or Word. The other options generate graphs displayed directly on the screen, which can be printed by clicking on the graph section.
Click ‘Go!’ to produce the report.